
Amazon IPI Score: Shattering the Myths

James McConnell

This article originally appeared on www.MarketplacePrep.comwww.MarketplacePrep.com and is syndicated here.
Amazon implemented the Inventory Performance Index Score (IPI Score) in 2018 and it has caused all kinds of confusion for sellers. Because of the way Amazon presents the score on the Seller Central Dashboard, sellers. This post breaks it down.
Before we start, your IPI Score is based on a 90-Day rolling-weighted-average of snapshots. This means IPI is calculated once a week (typically on Monday morning PST/Seattle time). So if you have one week where you have terrible inventory metrics, but it recovers a week later, you will likely only see a small, temporary decrease in your IPI score. On the other hand, if you are consistently getting worse and worse inventory management, then you will find it hard to increase the score rapidly.
Secondly, a few minor areas to talk about are that you must have a Professional Selling Plan and have inventory at FBA (Fulfillment by Amazon) for a significant portion the past 13 weeks.
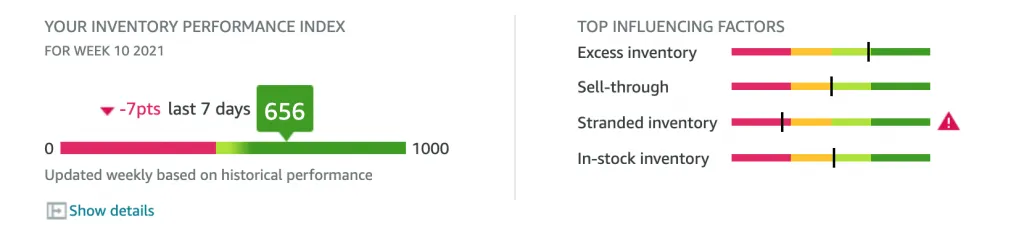
IPI Score Example showing Stranded Inventory, Excess Inventory, Sell Through, and In-Stock Rate The above image is an example of the Amazon Inventory Performance Dashboard’s IPI Score. Intuitively you would think that “Oh the IPI score is comprised of 4 simple parts! Let’s increase all 4 for a better score!”. Unfortunately, that is much easier said than done. In Q4 2020, we saw very large sellers with extremely precise inventory management struggling to maintain a 500+ score. This puzzled me and started my research.
The 4 Areas of IPI Scores
1. Stranded Inventory
Stranded inventory is “Units” based, not “SKU”. So if you have 100 SKUs down, but only 120 units stranded, you will be affected less than if you have 1,000 units down of 2 SKUs (assuming both have the same total units at FBA).
Formula: Sum of all Stranded Inventory units / Sum of all FBA Units Available * 100 = Stranded Inventory Percentage
Stranded Inventory typically has some of the lowest impact and easiest ability to fix. In most cases, stranded inventory can be resolved through either the “Fix Stranded Inventory” page or by opening a seller support case if the reason is due to a technical or inventory error.
Amazon recommends fixing all other metrics first. In my experience, stranded inventory does drop your IPI score, but the proportion it does is minimal.
2. Excess Inventory
Excess Inventory is one of those metrics that causes domino effects to other metrics. Overstocking inventory means more storage, less sell through, more excess inventory, and ultimately higher risk for Amazon.
Formula (ASIN specific): Units Available – (Average Units Sold per Day * 90) = Number of Excess Units
Excess Inventory is calculated based on if you have more than 90 days of cover/stock for a particular ASIN at your current sales velocity. Increase sales velocity or decrease stock to reduce your excess inventory units.
3. Sell-Through Rate
Sell-Through Rate is one of those metrics that people see as “I need to sell more”, but don’t really understand. Because this metric is by far one of the most weighted in the IPI calculation (because it calculates inventory efficiency), it is probably one of the more important ones to focus your time on. IPI Score metrics are typically pulled at the beginning of the week, so that “snapshot” is stored week-to-week.
Formula: Number of Units Sold in the last 90 days / Average Inventory Quantity* = Sell Through Rate
*Average Inventory Quantity = (Today’s Qty + 30 Days Ago Qty + 60 Days Ago Qty + 90 Days Ago Qty)/4
Sell-Through is effectively “Turnover” of a 90-day period. Because this is an average it will be very hard to pull this number up in a short period of time because you need to sustain great sell-through for 30 or 60+ days for it to start averaging in your favor. This means sending in more frequently, dripping inventory into Amazon from your supplier, 3PL, or facility, and maintaining lower inventory levels than you may prefer. It is a careful balance.
4. In-Stock Inventory Rate
This one is special. Your In-Stock Inventory Rate does NOT directly affect your IPI score. Amazon has confirmed this (linked below) on multiple occasions. However, there are things indirectly affected by running out of stock, such as more focus on slower-moving merchandise. Also, hiding SKUs from restock recommendations affects only your FBA in-stock rate, not your IPI score.
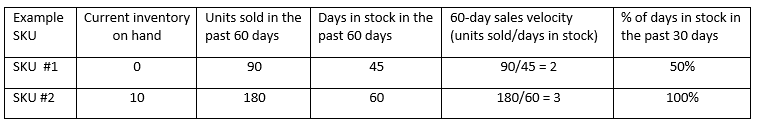
Formula (ASIN specific): FBA In-Stock rate = (Days in Stock the past 30 Days) / .3
Formula (Multiple ASINs): ( ASIN 1 [60-day Units Sold / Days in stock * FBA In-Stock rate] + ASIN 2 [60-day Units Sold / Days in stock * FBA In-Stock rate] ) / Sum of Each ASIN’s 60-Day Sales Velocity)
Example Chart Below: In this example below, the FBA In-Stock Rate for these two SKUs would be calculated as [(250%)+(3100%)] / (2+3) = 80%
4. Storage (The Hidden 4th Metric)
I won’t leave you hanging though, so let’s talk about Storage. Amazon implemented IPI score because storage space is limited in their warehouses. They don’t want “dead” inventory sitting in their facilities. With that, space becomes very valuable. I have personally seen and analyzed small and large sellers get penalized for physically large goods (Oversized Private Label products) or for large quantities of medium/large size goods (High variety shoe sellers). Amazon sees these products as taking up more space than other inventory, therefore the value those products bring is less. Ultimately it boils down to larger products are higher risk for Amazon as they can take up more space per dollar generated.
Sources: – Amazon’s Seller Forums post about the IPI Score Calculations – Amazon’s Help Pages for Inventory Performance – Amazon’s Help Pages for IPI Score Frequently Asked Questions – Extensive study and research while working with Amazon Sellers who utilize or need 3PL services to drip-feed inventory into Amazon FBA due to IPI score limitations. (Reach out to James if this is you!)